The Inventory Report page consolidates multiple reporting tools into a single, easy-to-navigate interface. Each reporting section can be accessed by selecting its corresponding column title, located in the center of the window.
Virtual Ops System Location/Navigation:
Reports > Inventory Report
Quick Links
Generating a Report
Reporting Types
Grid Column Information
Grid Action Buttons:
Column Visibility – By selecting this action you can change the visible columns per the grid you are on. These selections are saved per user/browser per grid.
Excel – Selecting this action will export the currently displayed grid data to excel.
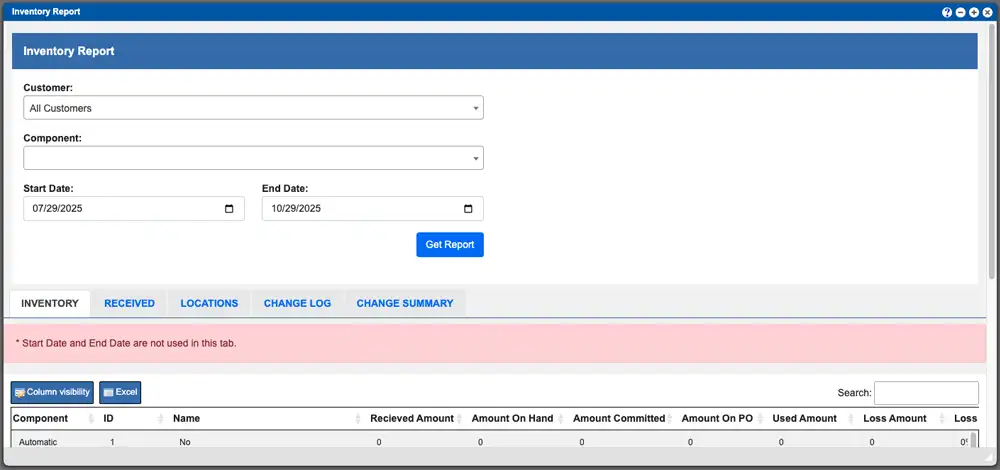
Generating an Inventory Report
By default, the page opens on the Inventory tab. The upper-right section of the window displays a dynamic pie chart summarizing key data from the generated report, such as item distribution or category totals.
To generate a report:
-
Select a reporting tab to choose the type of report you wish to view.
-
Configure your reporting metrics in the top portion of the window. This may include filters, date ranges, or other relevant parameters.
-
Click the blue “Get Report” button to create and display the report.
Component details per the report generated can be found in a grid at the bottom of the window (you might need to scroll down to view). You can adjust what columns are visible and where they are displayed with the Column Visibility action button. These grid entries can be sorted by clicking the column titles, using the search function or filtering by additional options using the inputs above the grid. For more information on Grid Sorting click here.
Available Inventory Reporting Types:
Inventory
The Inventory Report will provide inventory details for a specific component in your system. The provided details in the grid can include received amount, amount on hand/committed, used, loss and more.
Received
The Received report will provide details on how the component was received into the system. This report will utilize the date range settings. The provided details in the grid can include amounts, loss, PO information and more.
Locations
The Inventory Locations report is going to show you a record of location changes for any component in your system. The provided details in the grid can include location history, batch information, amounts, which system user performed the moves and more.
Change Log
The Change Log report will provide history details for a specific component. The provided entries in the grid will provide detailed history steps that the component took while in your system. These details will include receiving, scanner actions, exceptions and more.
Change Summary
The Change summary report in short will combine all of the entries produced from a change log report into a single summary. All of the changes made to a component in the system will be combined into sectional metrics and percentages.
Grid Column Information
There are instances where a column title is not descriptive enough or there is a formula that is manipulating the column data. This section is an effort to explain those instances.
Inventory Tab Grid Columns:
Received Amount – The amount originally received for the batch
Amount on hand – The amount avaialbe (received =/- exceptions/BPR’s)
Amount Commited – the Amount assigned to orders/BPR’s
Amount on PO – The amount on PO’s based on the settings in Administration -> Configuration -> PO Settings
Used amount – The amount assigned to BPR’s
Loss amount – The amount of exceptions that are less than zero that are not tied to a BPR
Loss Amount % – The percentage of loss divided by the amount received
Received Tab Grid Columns:
Amount Received – The amount originally received for the batch.
Amount Remainig – The amount avaialbe (received +/- exceptions/BPR’s)
Used amount – The amount assigned to BPR’s
Loss amount – The amount of exceptions that are less than zero that are not tied to a BPR
Loss Amount % – The percentage of loss divided by the amount received
Received On – the day the batch was received
Released On – The day the batch was released
Locations Tab Grid Columns:
Amount – The amount currently in that location
Change Summary Tab Grid Columns:
Start Amount- The amount that was available at the beginning of the date range selected.
Total amount Changed – the amount changed across all exception and BPR’s
Order Change – The amount of changes that were added for BPR’s/Orders
Order Change Percent- The amount of chages that were added for BPR’s/Orders divided by the Total Amount Changed
Manual Change – The amount of changes made manually (non BPR)
Manual change percent-The amount of manual changes that were divided by the Total Amount Changed
Cycle Count Change – The amount of changes made from a cycle count
Cycle Count percent-The amount of cycle count changes that were divided by the Total Amount Changed
